Client Memo: Math Is on Your Side | So Why Are You Still Afraid?
Apr 29, 2026Nearly 100 years of stock market data tells a clear story. The real challenge isn't knowing how to build wealth in the markets. It's staying rational long enough to allow the markets to work.
Turn on financial news during a rough stretch in the market and you'll hear words like "crash," "collapse," and "freefall" repeated with urgency. It sounds like reason enough to run. But step back from the noise and look at the full sweep of history, nearly a century of S&P 500 returns, and a very different picture emerges.
The stock market spends far more time rewarding patience than punishing it. The years people fear most are, statistically, the exception. And yet fear of those exceptional years is precisely what causes investors to miss the far more common exceptional gains.
Understanding the data is the easy part. The harder part, the part where real portfolios are won or lost, is recognizing how our minds distort that data in the moment.
The Scoreboard: Good Years vs. Bad Years
Since 1928, the S&P 500 has produced far more good years than bad ones. The frequency distribution table posted below, to me, is extremely insightful.
Most importantly, the really bad years, where the S&P 500 drops 20% or more, are very few. We have nearly 100 years of calendar year data below and just 6 (~6%) are those bad years. Most recently, and one most investors remember, is 2008 when the market fell 36.6%.
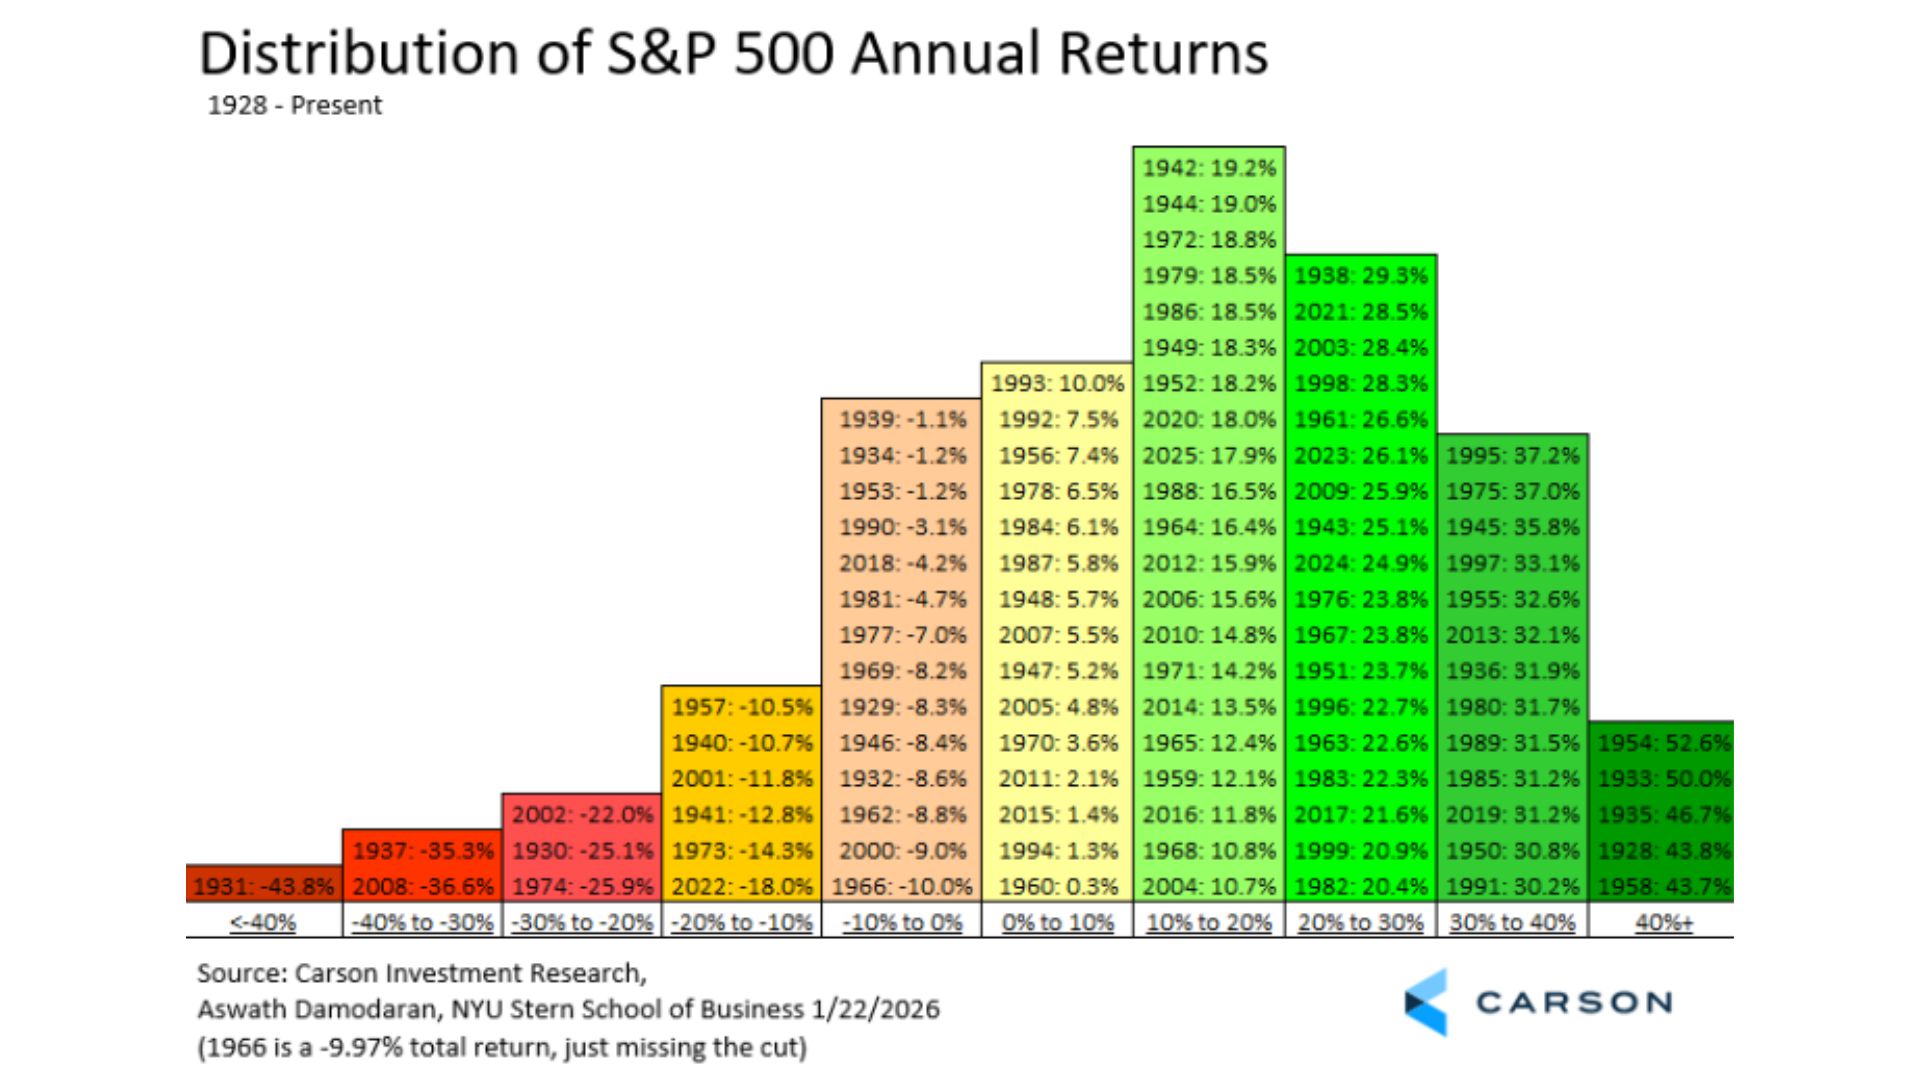
Add it all up and you have 73 years that are positive, 25 years negative, and an average return of 10.02%.
Three out of every four years is positive. But we worry most about that one negative. If you were told a casino game paid out 75% of the time and you walked away, someone at the table would think you were leaving money behind, because you were.
"If mistakes are driven by perception and bias, the solution isn't more information. It's better processing."
Anatomy of a "Crash Year": The Numbers
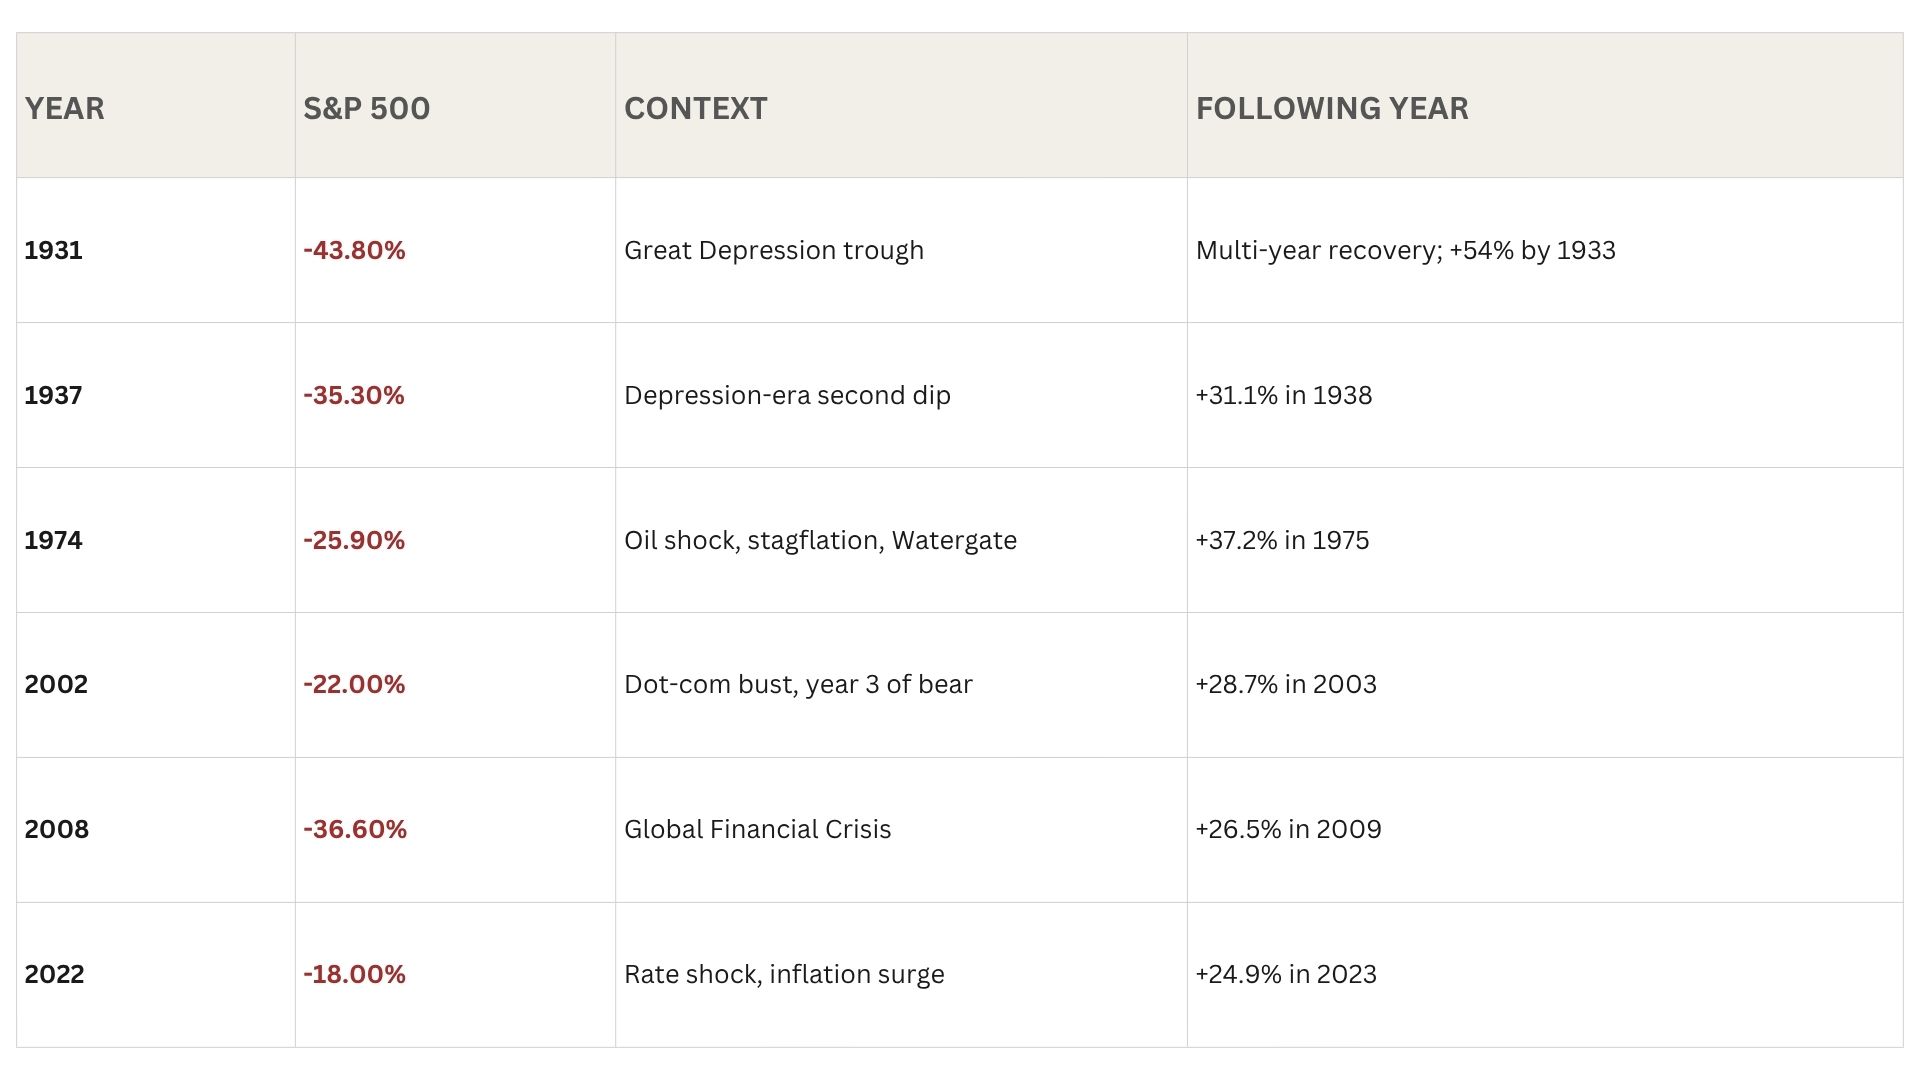
The red columns in the historical return chart represent the 6 years when investors lost 20% or more. Each of them felt, in the moment, like the end of something. None of them were. The table below shows those six years alongside 2022, the most recent severe down year, to illustrate the pattern of recovery that tends to follow.
 Source: Noble Wealth Management
A pattern repeats itself through history. The year after a severe decline tends to be one of the strongest on record. Investors who fled during the panic locked in the loss. Investors who stayed, or added, captured the recovery.
Why the Data Alone Isn't Enough
I’ve spent a lot of time on behavioral finance in the last couple of years. Investors have to be like Spock on Star Trek. For those old enough to remember, Spock was driven by pure logic as all people from the planet Vulcan were.
If human investors made decisions based purely on logic, none of this would be an issue. But they don't. Making mistakes is far more natural than making disciplined, long-term decisions. That isn't a character flaw. It's how people are wired.
The great investor and founder of Oaktree Capital Howard Marks once quipped about investing: Mistakes are essential to success. But not your own. Other people’s.
Essentially, learn from others’ pain and avoid the pain yourself.
The problem is most investors are human and not Vulcans and think more with emotions than with logic. Humans like to learn the hard way. Sometimes they don’t believe in the lessons of others and must experience it themselves.
This is where a financial advisor can add the most value to clients. They don’t start by helping clients profit from others’ mistakes but start by helping them avoid their own.
The trouble begins well before a bad headline hits. It begins with the steady stream of information investors take in every day: market performance, volatility, news, expert forecasts. Much of it is incomplete, biased, or engineered to provoke a reaction. Media outlets are rewarded for capturing attention, and negative stories do that better than balanced ones. Every forecaster has an angle, a narrative, and a position to defend. Data gets selected to support the story, not to reflect the full picture.
So even when investors believe they are being informed, they are often being influenced.
Then there's the part investors don't realize is happening at all, the unconscious layer. Behavioral science has established that our decisions are shaped by cognitive shortcuts and emotional responses that feel like clear thinking but aren't. They push us toward fast, reactive choices. They feel urgent. They feel right. That doesn't make them correct.
Over time, these biases show up as the same familiar mistakes:
- Buying more after markets have already risen
- Selling after markets have already fallen
- Overreacting to headlines that have nothing to do with your plan
- Abandoning a long-term strategy at the worst possible moment
These aren't knowledge problems. An investor can know, factually, that markets have recovered from every decline in history and still panic-sell in the middle of one. Fear doesn't consult the historical record. It operates on a faster, older part of the brain.
Stay invested, or miss the years that matter most
During the latest downturn, I had several clients who were, naturally, worried and near the brink of ‘selling out’ and going to cash. The thought is to stem the bleeding and buy back lower when the calm comes.
For every year the S&P 500 fell 20% or more there have been more than five years when it gained 20% or more. Bear markets themselves are rarer and shorter than investors assume. Since 1928, there have been roughly 12 bear markets, averaging about 14 months in duration. Bull markets have averaged over 4 years, with average cumulative gains near +180%. The asymmetry between the two is stark.
Here is the part that makes market timing structurally, not just behaviorally, so difficult: the best days and the worst days tend to happen in close proximity to one another. They are not randomly distributed across history. They cluster around the same periods of fear, volatility, and dislocation.
Seven of the ten best single days in the S&P 500 over the past two decades occurred within two weeks of one of the ten worst days. The March 2020 pandemic crash produced some of the fastest losses in market history, and some of the fastest gains. The same was true in 2008 and 2009. The same was true in 1987.
An investor who sells after a sharp decline, intending to step aside until things calm down, is not avoiding volatility. They are systematically selling before the volatility inverts. Recovery days don't wait for the news to improve. They usually arrive before anyone is comfortable returning.
The Bottom Line
Avoiding mistakes doesn't show up on a performance report. It shows up everywhere else: in following the plan, avoiding the pain of regret, and making it to the end of a market cycle with both capital and conviction intact.
This is where advisors create the most enduring value for their clients. Not by predicting markets. Not by reacting faster to headlines. But by helping clients think more clearly before they act, especially in the moments when clear thinking is hardest.
Math, across nearly a century of data, has always favored the patient investor. It still does. The question is never really whether the odds are good. The question is whether you can stay at the table long enough to let them work.
As always, we stand by to answer any questions or concerns you may have.
Sincerely,
Mark J. Asaro, CFA
Noble Wealth Management
Author


